
It’s been about eight and a half years since I made my first attempt at creating a statistical model for the NBA draft. Over the years the model has seen a number of changes and improvements, so in reality this is something like DMX 10.0. This new version represents a major overhaul which I thought required some explanation both for those familiar with the DMX model and for the uninitiated.
THE DATA
The dataset that I used to build the model includes box score stats for 570 draft prospects from 2012 to 2016. It also contains other player data such as age, height, and strength of schedule (NCAA SOS based on KenPom’s strength of schedule rating). One change from the previous model is that I added each player’s pre-draft year stats along with their career averages. The sample includes pretty much every draft pick in that timeframe who played NCAA or in a pro league overseas, as well as 280 undrafted players. The list of undrafted players was taken from the draft pages on RealGM, which also provided pace adjusted stats and other player data. This isn’t a completely random or representative sample, but it is large enough to encompass a wide range of player types and NBA outcomes.
FEATURE ENGINEERING
A major part of building the model was creating new variables or features by combining existing data points. Some are intuitive, like converting per 40 minute numbers to per game, or calculating eFG% and TS%. Others are more ad hoc metrics like the combination of rebounding and assist-to-turnover ratio, as mentioned in my write-up on the great Darrion Williams. In all, there were 168 numerical variables attributed to each prospect.
THE LASSO
I tested out a number of modeling techniques and the one that performed the best was the lasso regression. I won’t get into too much detail here, but essentially the lasso creates a simplified model by selecting the most significant variables and setting all of the others to zero. For the target metric I considered VORP per year, Win Shares per year, or some combination of both (data courtesy of Basketball-Reference). Ultimately I used VORP per year, which tested the best on out-of-sample data and at least somewhat reined in the bias towards big men. The final model, built on a random 2-1 test/train split, uses 15 variables which include more obvious factors like age and strength of schedule, some basic per game and per minute stats, and several of the “home brewed” metrics.
THE RESULTS
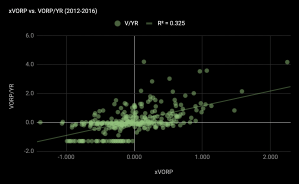
The mean squared error for the model projections (xVORP) to VORP per year on the in-sample draft picks is .56 and the R-squared value is .325.
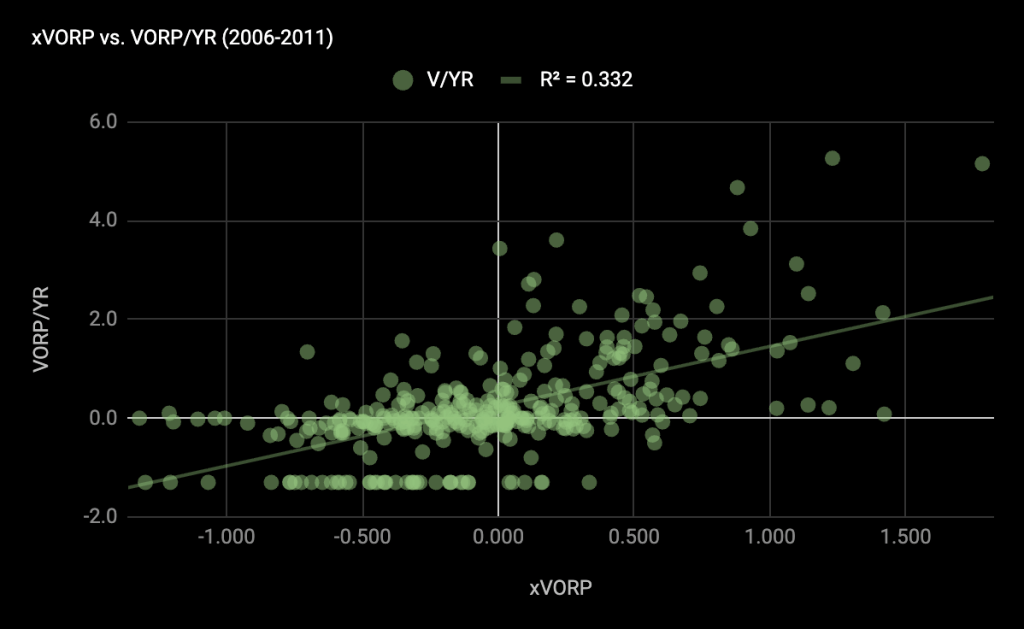
To evaluate the performance of the model out of sample, I looked at the six prior draft classes. The out-of-sample MSE increases to .77, but the R-squared correlation to VORP per year is actually a bit better.
The complete model projections dating back to the 90s can be seen here, and there is also a link in the sidebar. Stay tuned for the 2025 projections and more draft model-adjacent content!

Leave a comment